Our DNS infrastructure in focus
How we ensure that .nl is always immediately accessible, wherever you are
How we ensure that .nl is always immediately accessible, wherever you are

The original blog post is in Dutch, this is the English translation of it.
One of SIDN's core tasks is making sure that .nl is always immediately accessible to everyone, everywhere on the internet. That's no straightforward undertaking, because the internet is constantly changing and constantly facing cyberthreats. In this blog, we describe how our DNS team rolls out and manages our DNS infrastructure, and the new dashboards that SIDN Labs has developed to facilitate monitoring.
SIDN ensures that all .nl domain names and the associated data are recorded in a central register. But that's not all we do. We also publish that information in the DNS (Domain Name System), so that your device can find out what IP addresses go with what domain names.
The IP address for a domain name is discovered by asking the domain name's authoritative name server. And your device finds out where the name servers for .nl domain names are by asking .nl's authoritative name servers, which we operate. That's all done invisibly as you use the internet, with lots of messages going back and forth between your device and the name servers. Every day, we get roughly 4 billion DNS queries about .nl domain names from internet users all over the world.
Without our authoritative name servers, no one would be able look up .nl domain names in the DNS, making it practically impossible to reach .nl websites. So it's super important that the .nl name servers can always be reached. And reached quickly, from anywhere in the world. Because, if our name servers were slow to respond, .nl websites would take longer to load.
We do a number of things to assure the accessibility of .nl.
First, we make use of IP anycast. That's a method for making an internet service – in our case a .nl name server – available at a variety of places around the world using a single IP address. We've got a .nl name server running in Amsterdam, another in New York, and many more in other places, all of which can be reached at the IP address 194.0.28.53.
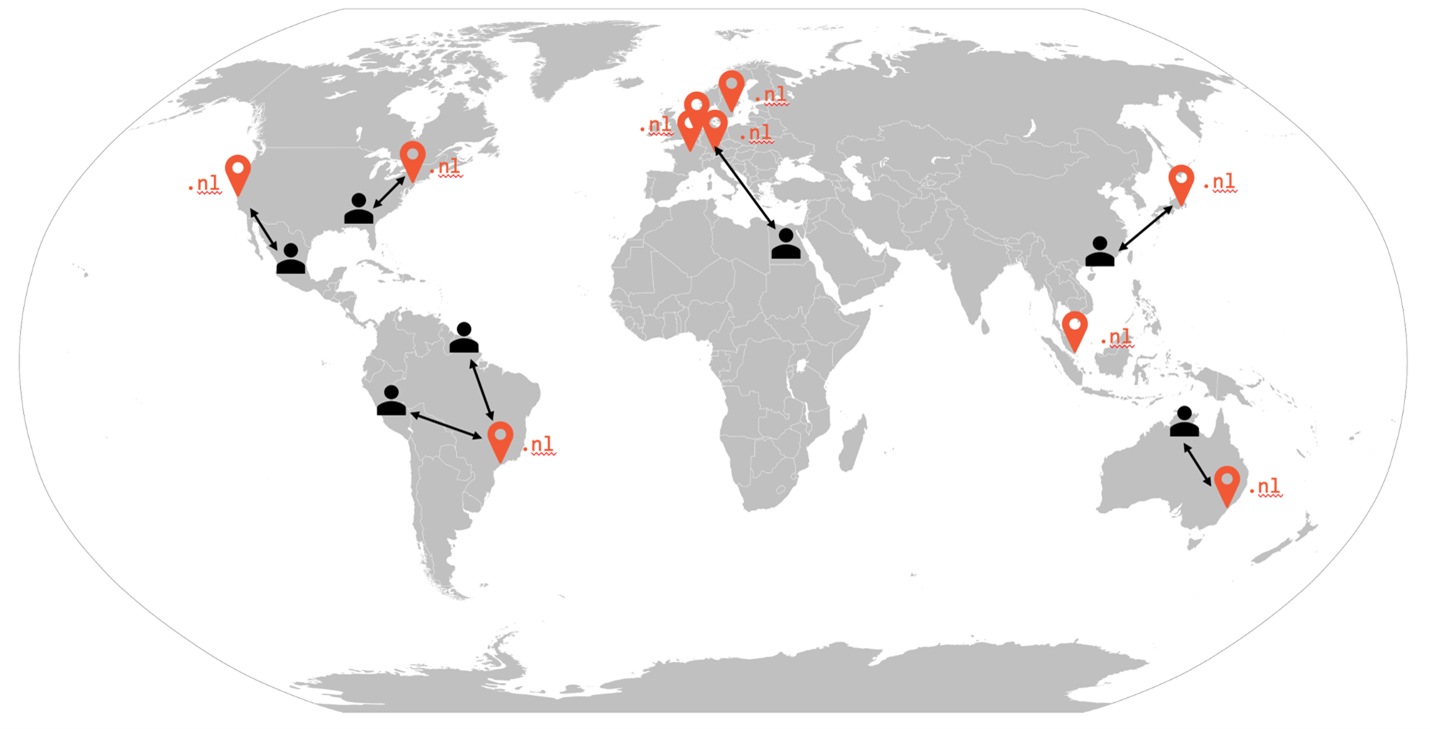
Information moves around the internet in the form of data packets, which are passed along a chain of routers until they reach their destination. Each router knows roughly what route the packets need to take in order to arrive at the destination IP address as quickly as possible. IP anycast is simply a way of adding extra instances of the destination, so that data gets routed to the one that can be reached in the shortest time. The way it works is illustrated in figure 1.

Figure 1: global rollout of .nl name servers using IP anycast.
IP anycast has 3 big advantages. First, if any single server location goes down, it's no big deal: internet users get routed to a working location without ever noticing the difference. Second, it makes the service faster. A query from a user in Australia doesn't have to go right around the world to a server in the Netherlands, but goes straight to our server in Sydney. The user's device therefore gets the information it needs roughly 30 times faster. Finally, IP anycast is less vulnerable to DDoS attacks. In the event of an attack, the traffic gets distributed across the various servers around the world, making it less likely that any one of them will be overloaded.
Another thing we do is work with partners around the world. CIRA, the registry that runs Canada's .ca domain, and NIC.AT, who run Austria's .at domain, both operate copies of the .nl name servers to support our own infrastructure. We send each of them an updated copy of the .nl zone file every half an hour. They then publish the copy on their name servers, just as we publish the original on ours. So the .nl domain could still be reached, even if we, or one of our partners, made a major mistake with the name servers or got hit by a cyber-attack. In the same way that CIRA and NIC.AT help us keep .nl running smoothly, we help the registry for Demark's .dk domain by hosting the .dk zone file on ours servers.
Together, we and our Canadian and Austrian partners operate more than 80 servers spread all around the globe, ensuring that .nl is always immediately accessible from anywhere.
Various things can be done to make sure that the .nl name servers are both fast and able to withstand online attacks. For example, with worst-case scenarios in mind, our system capacity is greatly overdimensioned.
We're committed to making our name server infrastructure as scalable and flexible as possible, so as to maximise resilience to cyberthreats. As explained above, we also use anycast so that the name servers can respond quickly to internet users all over the world, and so that no single server has to handle too much traffic. Consequently, we can quickly scale up our capacity regionally or globally if the need arises. Our use of rented hardware means that both horizontal upscaling (more servers per location) and vertical upscaling (more powerful servers) are possible. Anywhere in the world! Name server capacity is in any case considerably overdimensioned to enable us to cope with 'normal' peaks in DNS query traffic. However, the set-up described means we can bolster capacity much further still, whenever we need to.
Everything is made possible by rolling out our name servers automatically using Flatcar Linux: a Linux distribution pared back to the absolute minimum, exclusively for running processes in containers. The server configuration is predefined and can't be modified once the name server is running. That gives us what's known an 'immutable infrastructure': a set-up designed to maximise the security and stability of the servers.
All platform components are automatically rebuilt and tested using CI/CD pipelines once a week. At the same time, we scan for vulnerabilities, both in the code we've written ourselves and in code obtained from external sources. We also do automatic tests to make sure all the containers are working properly. Errors are therefore picked up early, before they can cause problems in production. So we keep a firm grip on the server configuration, and we're able to revert to an earlier version if problems ever arise.
Our commitment to automation means that the process of name server building, testing and rollout requires very little manual attention. As well as enabling us to scale up quickly whenever additional capacity is needed, automation allows improvements and new functionality to be put into production early, in a fully controlled manner. Prototypes can quickly be put together and dismantled again. Meaning that we can give ample attention to continuous improvement of our anycast platform, led by the measurement data we collect.
A few years ago, we developed ENTRADA, a tool for processing DNS query data from the .nl name servers and recording it for research purposes. ENTRADA has since compiled a huge DNS dataset, providing a great deal of information that has helped us to understand how the .nl name servers work in great detail. For example, we can visualise how many DNS queries each .nl name server location handles, and how long it takes to answer DNS queries from different parts of the world.
SIDN Labs and the SIDN DNS team have invested considerable time in a joint effort to visualise the metrics for monitoring purposes. The resulting graphs are also ideal for a blog like this, whose purpose is to describe our DNS infrastructure.
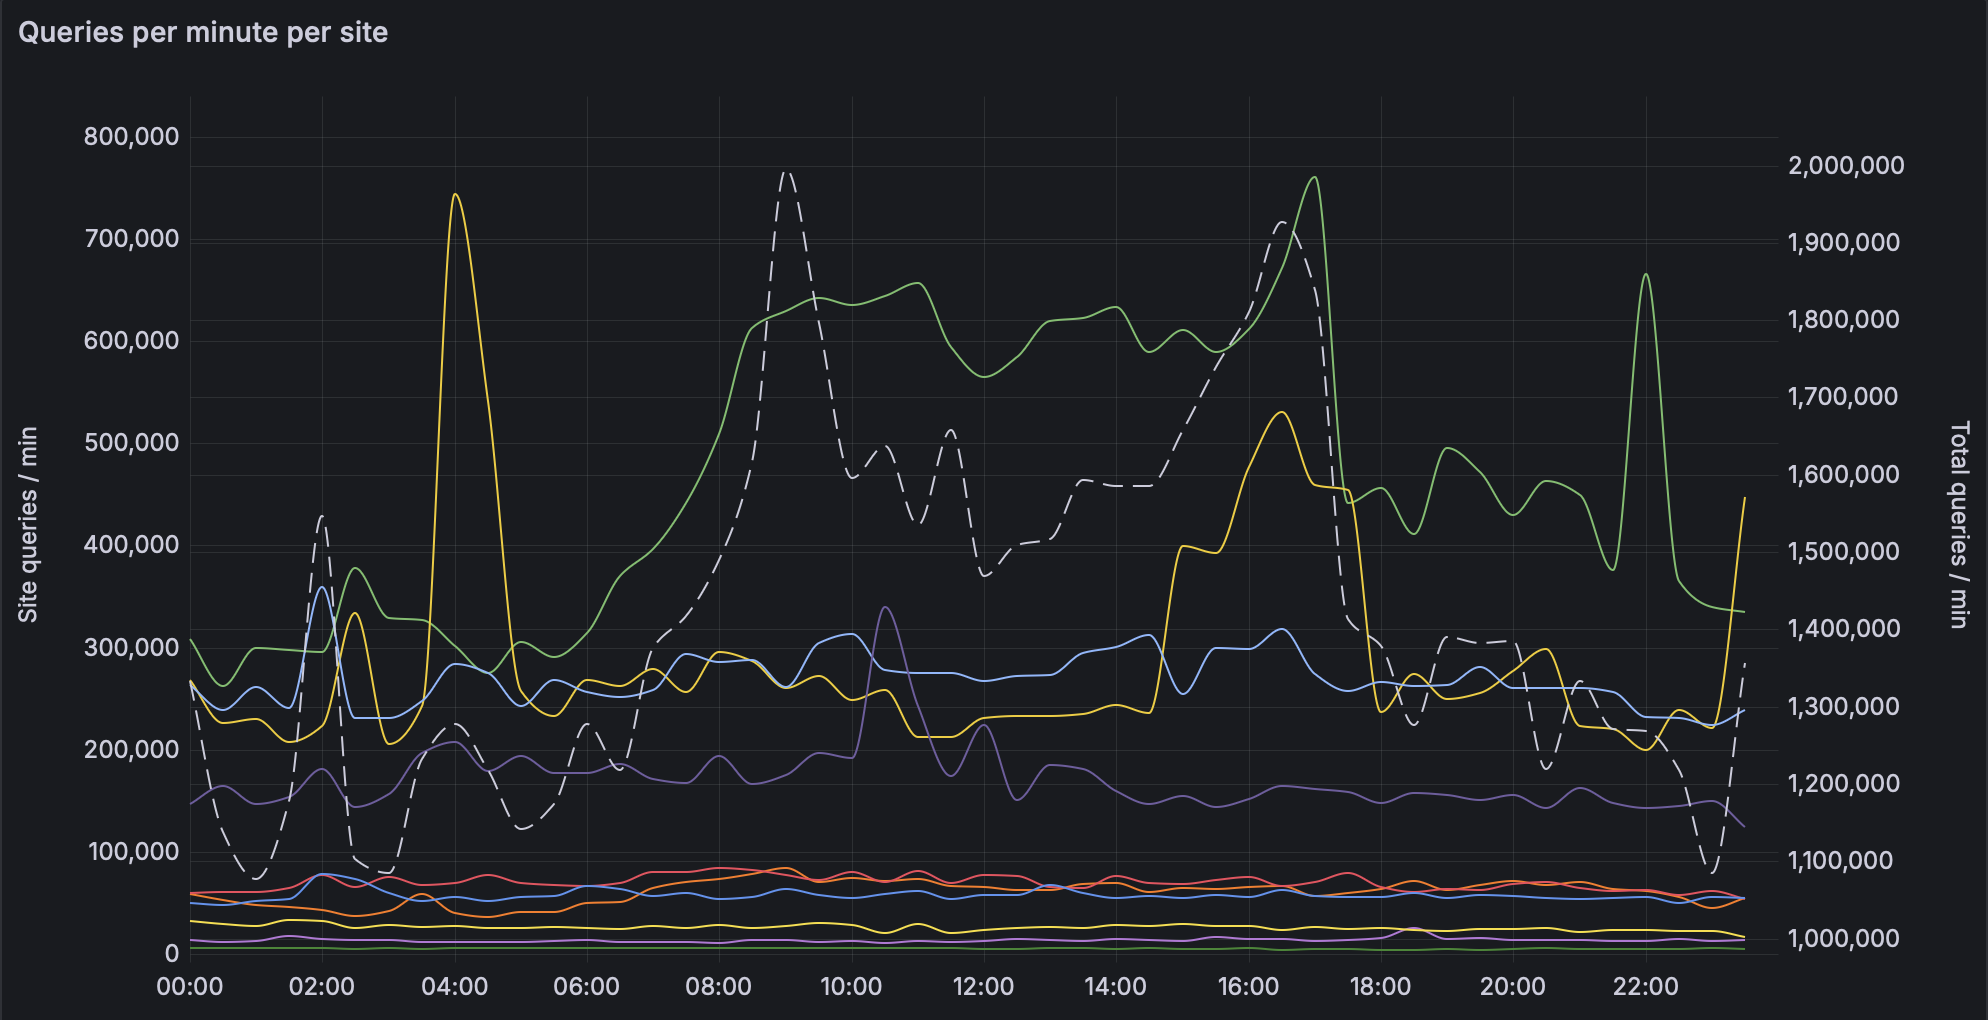
A number of the graphs – which we also refer to in our day-to-day work – are presented below. Figure 2 shows the number of queries received by the various .nl name servers that we operate.

Figure 2: Number of DNS queries per minute, per name server.
The graph shows us that the number of queries handled by some name servers varies quite a lot, while servers at other locations have fairly stable query traffic. We can also clearly see the Netherlands waking up: DNS traffic to the server in Amsterdam (green line) picks up considerably as the day starts.
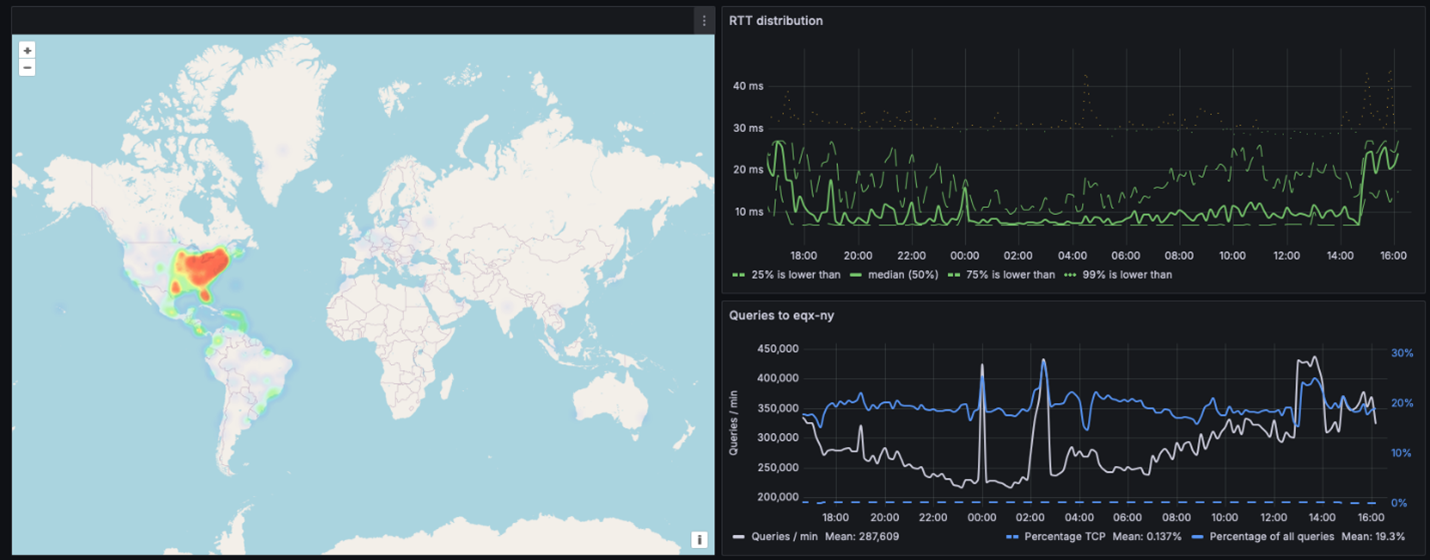
In figure 3, we zoom in on the stats for a particular .nl name server in New York. We can see where the traffic to that location comes from (known as the server's 'catchment'). We've also plotted a number of stats on the latency of queries to that server (how quickly they are answered), and how the number of queries changes over time. We produce graphs like these for each of the .nl name servers we operate, so that we can see how each of them is doing.

Figure 3: Close-up of the name server in New York; catchment, latency and number of queries over time.
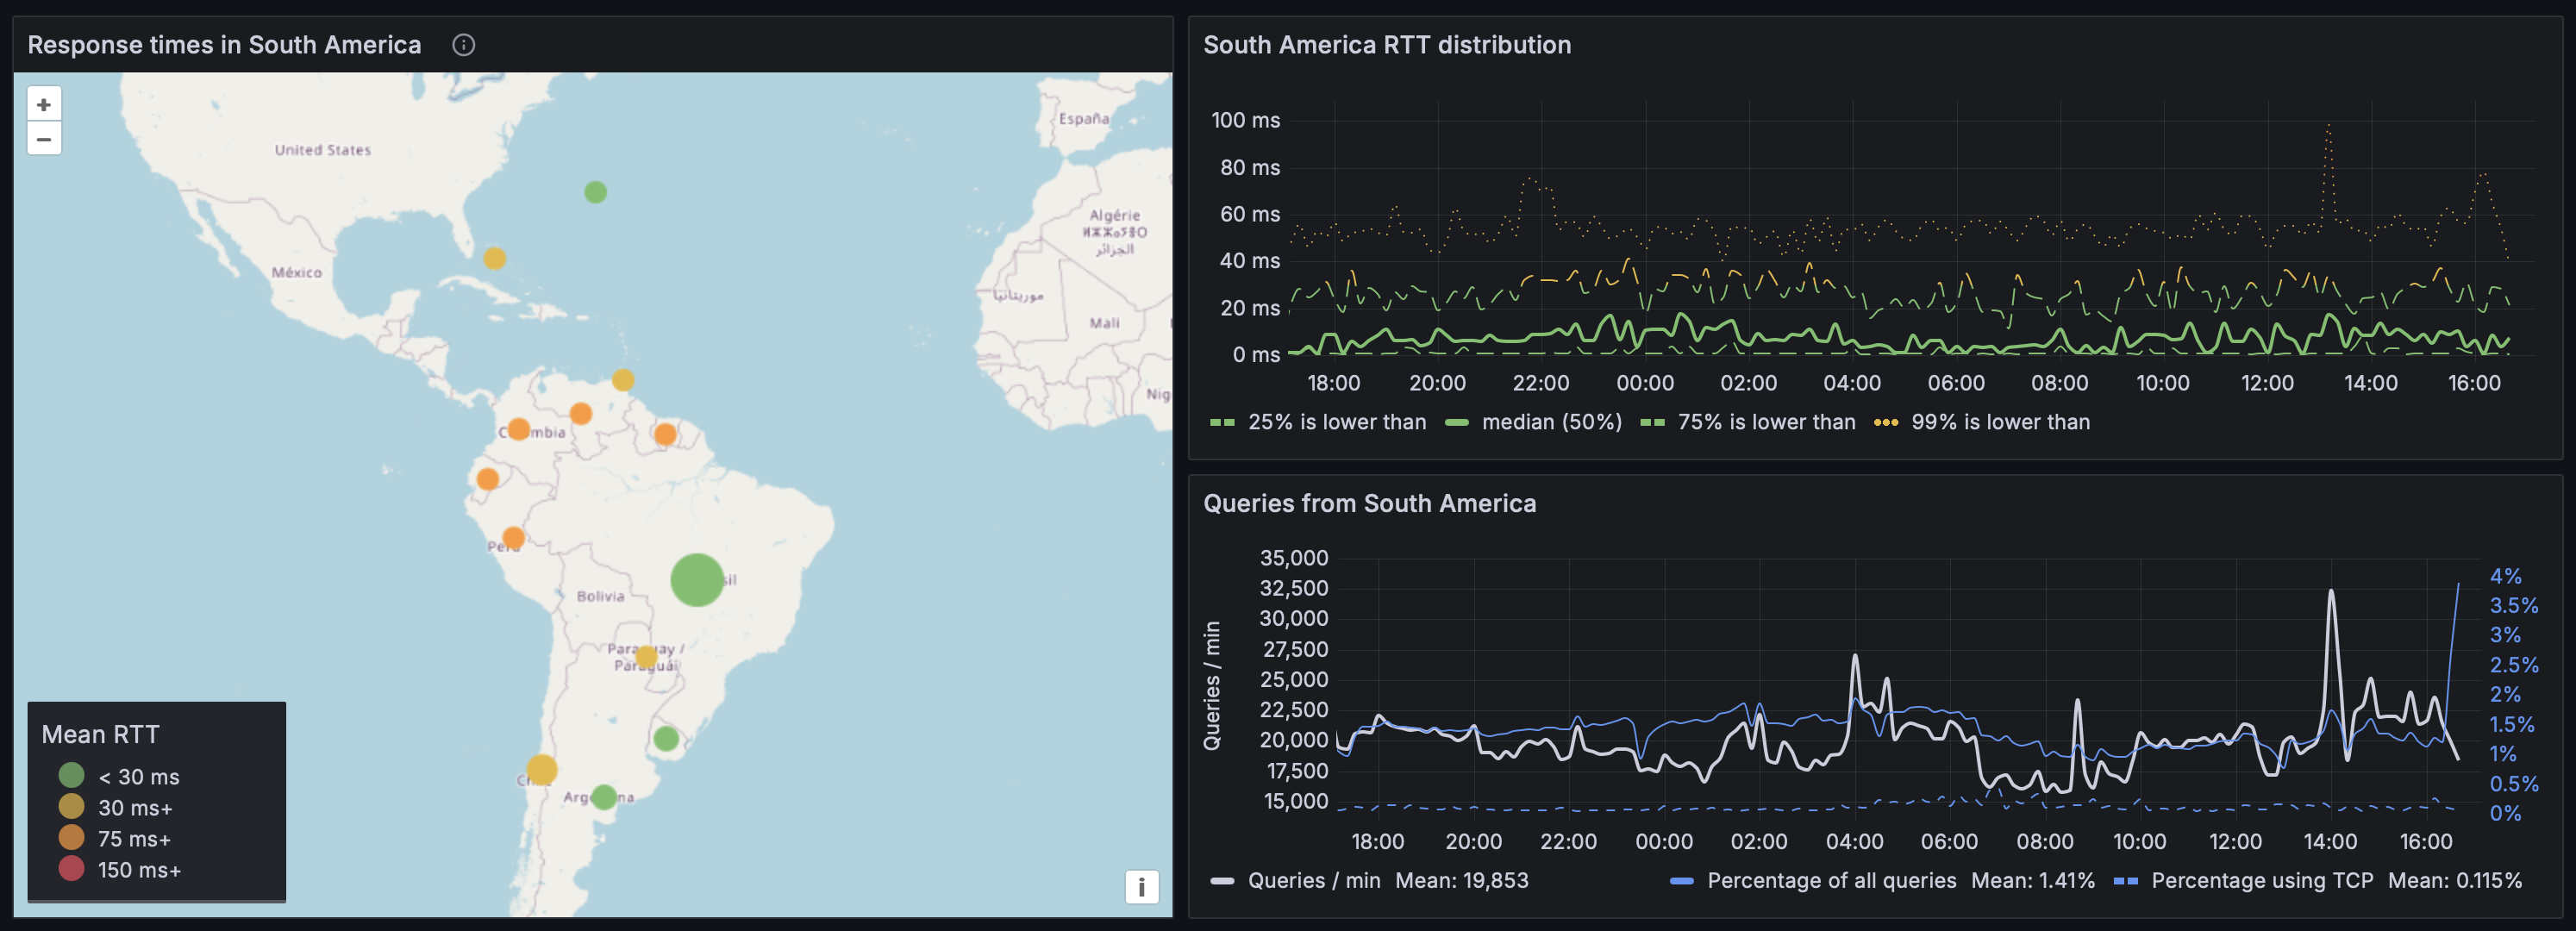
Finally, figure 4 visualises data on queries from a particular region, in this case South America. In other words, it shows the situation from the viewpoint of the resolvers in that region, rather than from the viewpoint of our name servers. For each country in the region, the map tells us how many queries are generated (the size of the dot) and the average latency (the colour of the dot). Again, the latency stats and query numbers are visualised as well. We generate graphs like these for each continent and each of a number of smaller regions that we're particularly interested in.

Figure 4: Numbers of DNS queries from South American countries and associated latencies.
The insights provided by these visualisations help us to make better decisions about upscaling or downscaling our infrastructure, and to detect problems, such as a spike in the latency for a given part of the world.
As well as visualising passive measurement data gathered automatically while the service is operating normally, we carry out our own active internet measurements. That involves sending out internet packets to a large number of internet destinations in order to observe how they're routed and how long it takes them to reach their destinations. The findings enable us to do things such as make intelligent, data-driven decisions about the best locations to roll out .nl name servers so that DNS queries from all around the world are answered as quickly as possible. We're currently hard at work developing an optimalisation algorithm for that purpose. Details to follow in a future blog post!


